2014 U.S. Bankruptcy Filing Rates: Back to Normal?
Q3 2014 U.S. Bankruptcy Filing Statistics, released recently on uscourts.gov, provide more bad news — and some good news — for practicing bankruptcy attorneys.
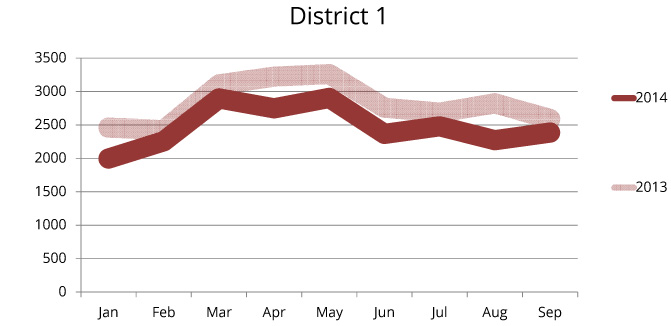
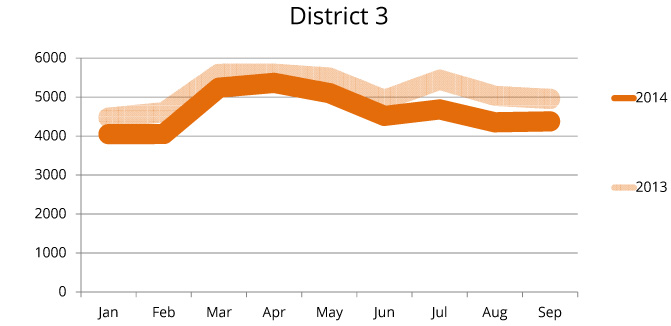
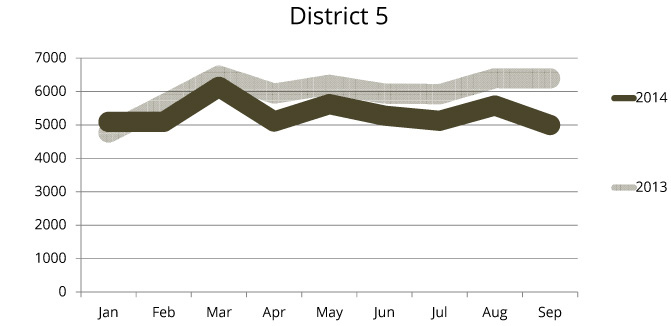
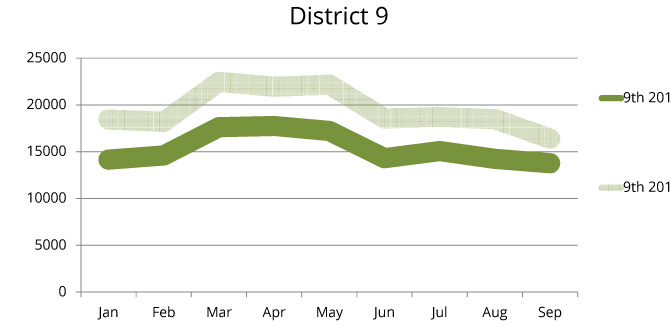
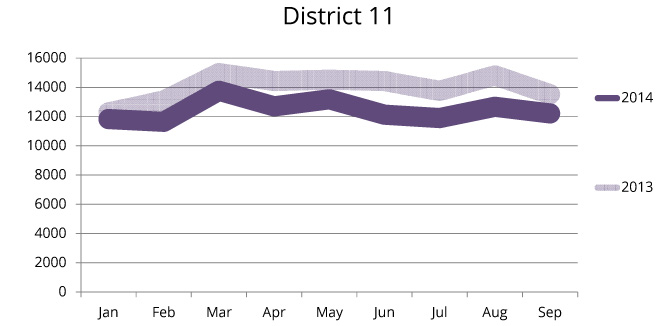
Nationally, total bankruptcy filings dropped 14% in September 2014 from September 2013. While District 5 filings dropped a whopping 22% from the same period one year ago, other districts declined as little as 4% (District 7).
Back to Normal?
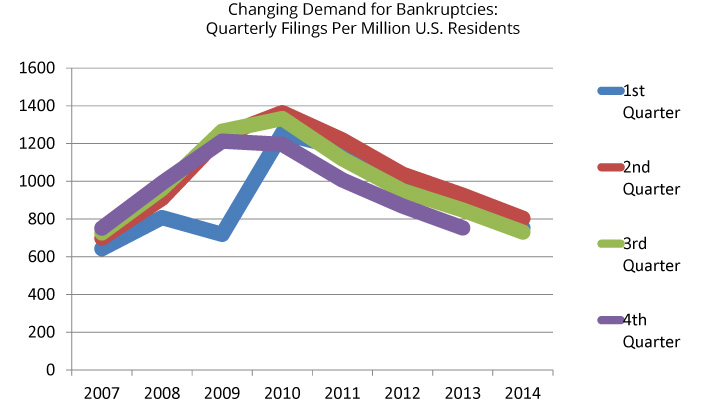
However, further declines in the bankruptcy filing rate now seem unlikely. As of Q3, 2014, total U.S. bankruptcy filings have finally returned to 2007 (pre-recession) levels. This “baseline” is about 730 total filings per quarter per million U.S. residents. Q3 2014 filing levels nationally were 731 bankruptcy filings per million U.S. residents.
Following implementation of 2005’s Bankruptcy Abuse Prevention and Consumer Protection Act, bankruptcy filings in 2006 and 2007 significantly declined from early 21st century levels. 2007 was the last year prior to the great recession and therefore the closest index year under the new Act.
Total filing levels again peaked in Q2 2010 at 1364 filings per million U.S. residents. Q3 2014 filing levels represent a 45% drop from filing rates four years earlier.
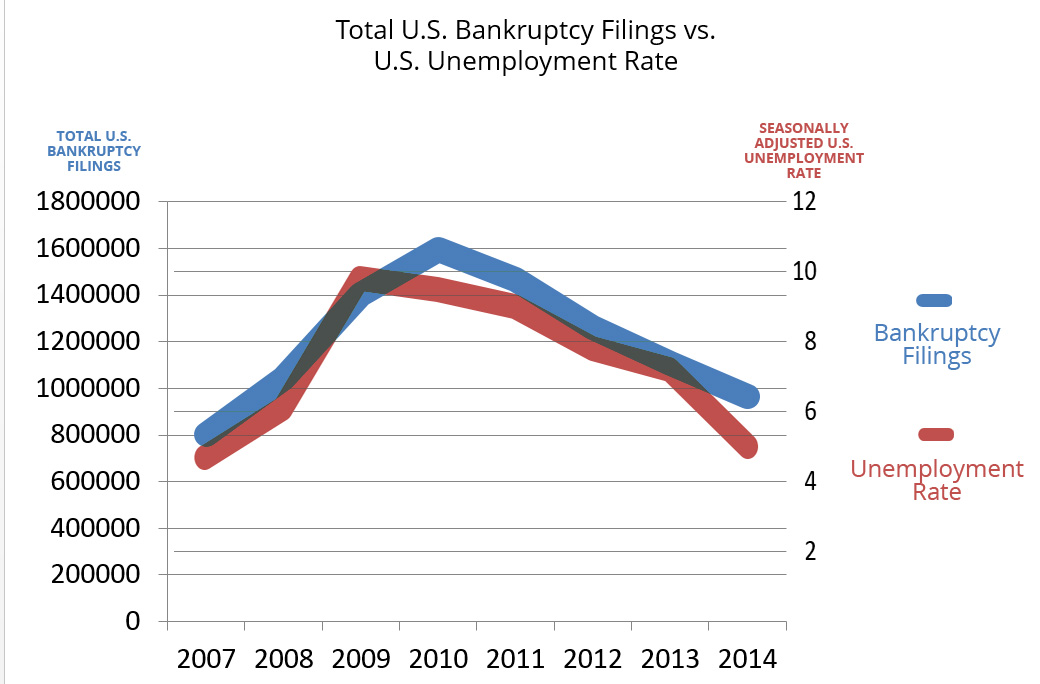
This trend follows the same trend in the U.S. unemployment rate, implying a cause-and-effect between the two. While in the graph below, bankruptcy filings have not yet reached their baseline 2007 levels, it is simply due to the 12-month figures used here. As stated above, Q3 2014 filings have, in fact, reached Q3 2007 levels.
The good news
It may now be safe to say that demand for filing bankruptcy has finally normalized again, after seven rollercoaster years. Filing levels declined at their slowest rate in September 2014 from the same period one year earlier, and it appears likely that filing levels will continue relatively unchanged through Q4 2014 and 2015.
How did your district perform?
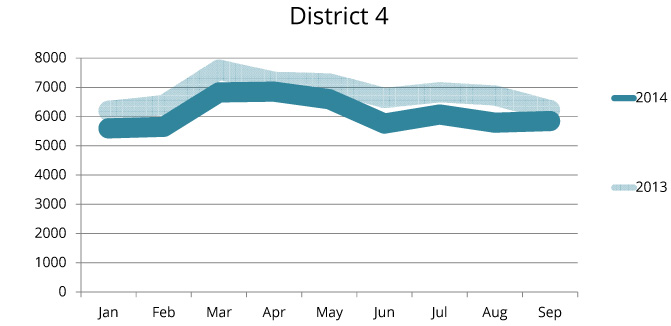
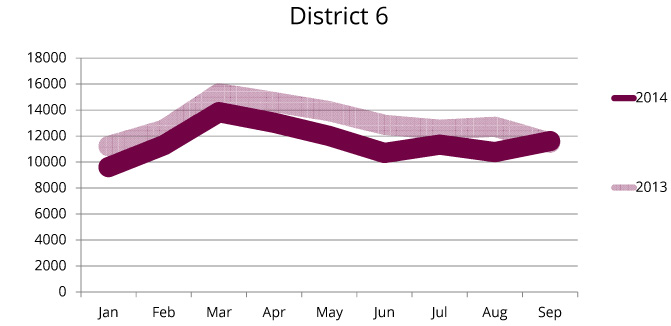
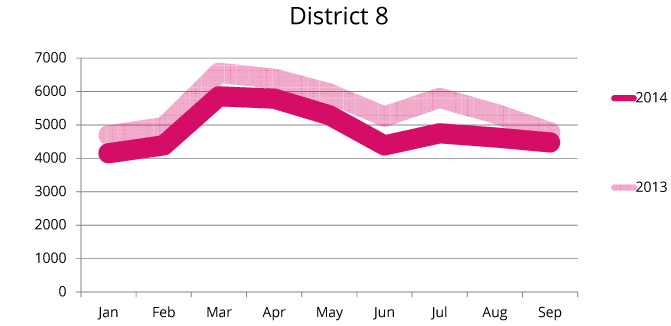
By district, here is how September 2014 filing levels compared to 2013:
If your bankruptcy law firm is looking to increase its client caseload in the current market conditions, use of advanced digital lead generation can help. To find out more, download our free White Paper, Guide to Generating New Clients for Consumer Law Firms, or contact LeadQ directly.
LeadQ produces custom lead generation campaigns for bankruptcy attorneys across the U.S. in which attorneys pay only for the exclusive, Qualified, new client inquiries we generate to their firms.
Comments are closed.


